|
News & Events |
| |
|
Lots of stuff is going on.
|
 |
|
More... |
Featured Solution |
| |
 |
|
The research on tDCS
Read More
|
|
|
|
| |
|
|
| |
Quantitative EEG!
|
| |
|
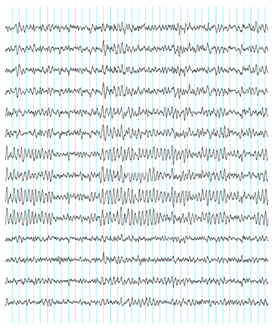
qEEG is a new form of Electroencephalography
(EEG). Basic EEG is a very well-established process
by which electrical patterns generated by neurons
in the cortex (the outer wrinkles surface of the
brain) are read at the surface of the scalp via
small electrodes.
The activity is often referred
to as "brainwaves" because the traditional way
of recording it is to show the wave-like traces
from each sensor - a measure of how many times
each second those cells are turning on and off.
This type of EEG reading is limited to activity
in the cortex, the surface of the brain. It does
not give information about the deeper, (limbic)
areas which play an important role in behaviour,
especially that concerned with emotional responses.
|
|
|
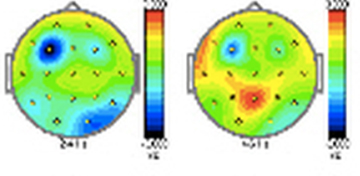
| Quantitative
EEG (qEEG) is the analysis of digitized EEG data
by very sophisticated computer software. The software
compares and combine the outputs of all the electrodes
in the EEG montage (Neuroprime uses a 20 channels.)
However, instead of displaying a separate read-out
from each sensor it produces a complete picture
of how the brain is functioning, including areas
below the cortex which give rise to emotions and
unconscious behaviour. Each type of activity can
be shown separately, from the very slow delta waves
(<4 Hz) which mark a sleep to the ultra fast (>40Hz)
gamma activity that occurs when groups of neurons
are generating conscious thoughts and feelings.
The process is known as "Brain Mapping". Neuroprime
Brain Balancing takes a full qEEG brain map from
the client and compares it to a map of normal brain
activity. The "norm" is derived from the combination
of thousands of qEEGs which have been taken from
healthy people. ? |
|
|
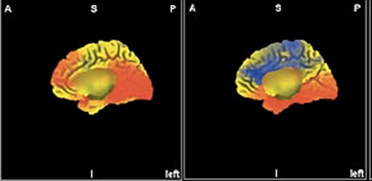
| qEEG
data can be displayed as "brain maps" top, or, using
a different type of software, as three- dimensional
images |
|
|
|
In qEEG it is important that the norm used for
comparison is a true representation of healthy
brain activity, and accuracy depends crucially
on the size of the database. Neuroprime compares
clients' qEEG against one of the largest collections
of healthy brain maps, the Human Brain Institute
normative database. This is based on fundamental
research at the Institute of the Human Brain Russian
Academy of Sciences in St. Petersburg, Russia,
and has since been augmented by data from Praxis
für Kind Organisation und Entwicklung, Chur, Switzerland,
Norwegian University for Science and Technology
(NTNU), Trondheim, Norway, Crossroads Institute
in the USA and Q-Pro Worldwide (USA, Switzerland,
and Russia).
By comparing the brain maps taken from the patient
to the norm, any activity which is significantly
abnormal become apparent. The first scrutiny is
carried out by a medical neurologist to check
that there is no overt brain injury or disease
which requires medical attention. If a problem
of this sort is detected our neurologist may offer
a consultation or the patient will be advised
to contact their own doctor. Assuming the medical
screening is clear, the brain maps are then interpreted
by a leading qEEG expert.
Co-occurring disorders and subtype distinction
In addition to the client's main complaint qEEG
can show up secondary problems that might otherwise
be masked by the presenting conditionn. Given
the dense interactivity of all neural pathways
in the human brain, a person showing dysfunction
in one area is very likely to have "knock-on"
abnormalities in other regions - indeed, co-morbidity
is the rule rather than the exception. For example,
compared with the general population, people addicted
to drugs are roughly twice as likely to suffer
from mood and anxiety disorders, with the reverse
also true. 3
Brain maps will show up these secondary problems
even if the behavioural symptoms are not obvious.
Hence it is possible to treat the "second layer"
of problems, and minimise the likelihood of relapse
and/or another problem taking the place, seemingly,
of the one that is ameliorated.
|
|
|
| qEEG
also gives the clinician a clear guide to the client's
underlying brain malfunction. Many conditions can
be caused by several different brain "glitches".
For example, depression may be due to abnormal activity
in frontal lobe pathways, or in the reward centres
or amygdala, or in all of them. Although the symptoms
of each may be identical, their triggers and prognosis
may be quite different. Conventional clinical diagnosis
is generally unable to distinguish the subtypes
and therefore cannot select the most effective treatment.
This is one reason why different people respond
to different antidepressants and why some people
do not respond to them at all. ? |
| qEEG
signatures |
| A wide
range of conditions are known to be marked by distinctive
qEEG "signature". The qEEG analysis pinpoints the
neural pathways which are functioning abnormally,
and allow neurofeedback and tDCS to be precisely
targeted to these areas. These are examples of qEEG
"signatures". Many conditions have a large number
of subtypes, so different qEEG markers may be seen
in people with similar behavioural presentation.
Treatment protocols therefore need to be fine-tuned
to each person, and qEEG allows this to be done.
Although neurofeedbak and tDCS can be carried out
without qEEG, when used in combination the effect
is far greater because it allows for individual
differences. Neurofeedback plus qEEG, for example,
has been found to be twice as effective as neurofeedback
alone.4 |
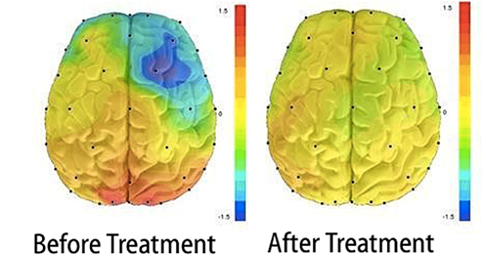
| Measurable
results |
| As
well as diagnosing problems and determining treatment
protocols, qEEG may be used after treatment to give
a clear measure of effect. Colour-coded markers
of dysfunctional activity from the diagnostic qEEG
can be compared directly with post-treatment readings
so the clients can see for themselves the difference.
The qeeg brain map below shows the difference in
an alcohol addict's functioning before and after
treatment with neurofeedback |
|
|
| |
|
|
| |
|
|
|